Planning
Community Needs Assessment (CNA)
Every five years, DCYF engages children, youth, Transitional Age Youth (TAY), parents, and service providers in a Community Needs Assessment (CNA) to determine the services that are needed to realize the vision of the Children and Youth Fund. For DCYF, our CNA is an opportunity to devote time and energy to listen to community members, to understand the strengths and challenges facing San Francisco children, youth, and families, and to lift their voices and amplify their impact. Equity drives our approach to collecting and analyzing data to generate findings that help us prioritize services that will address the needs of our children, youth, and families.
-
How are children, youth, TAY, and families faring in San Francisco?
What groups of children, youth, TAY, and families face significant disparities in opportunities or outcomes?
What are the service needs of children, youth, TAY, and families in San Francisco? How has COVID-19 changed well-being and service needs?
What are the services and resources that are available in low-income and disadvantaged communities compared to the services and resources that are available citywide?
What are existing programs, services, and community assets that enable children, youth, TAY, and families to thrive in the face of everyday adversities? What assets might support communities in recovering from the impacts of COVID-19?
Community Engagement
Community engagement for the CNA began in August 2019 and concluded in January 2022, with a pause between March 2020 and March 2021 due to the COVID-19 pandemic. We spoke directly with children, youth, and families through focus groups, surveys, interviews, and outreach events.
For more insight into the findings from our community engagement efforts, please read our community engagement summaries:

Key Findings

-
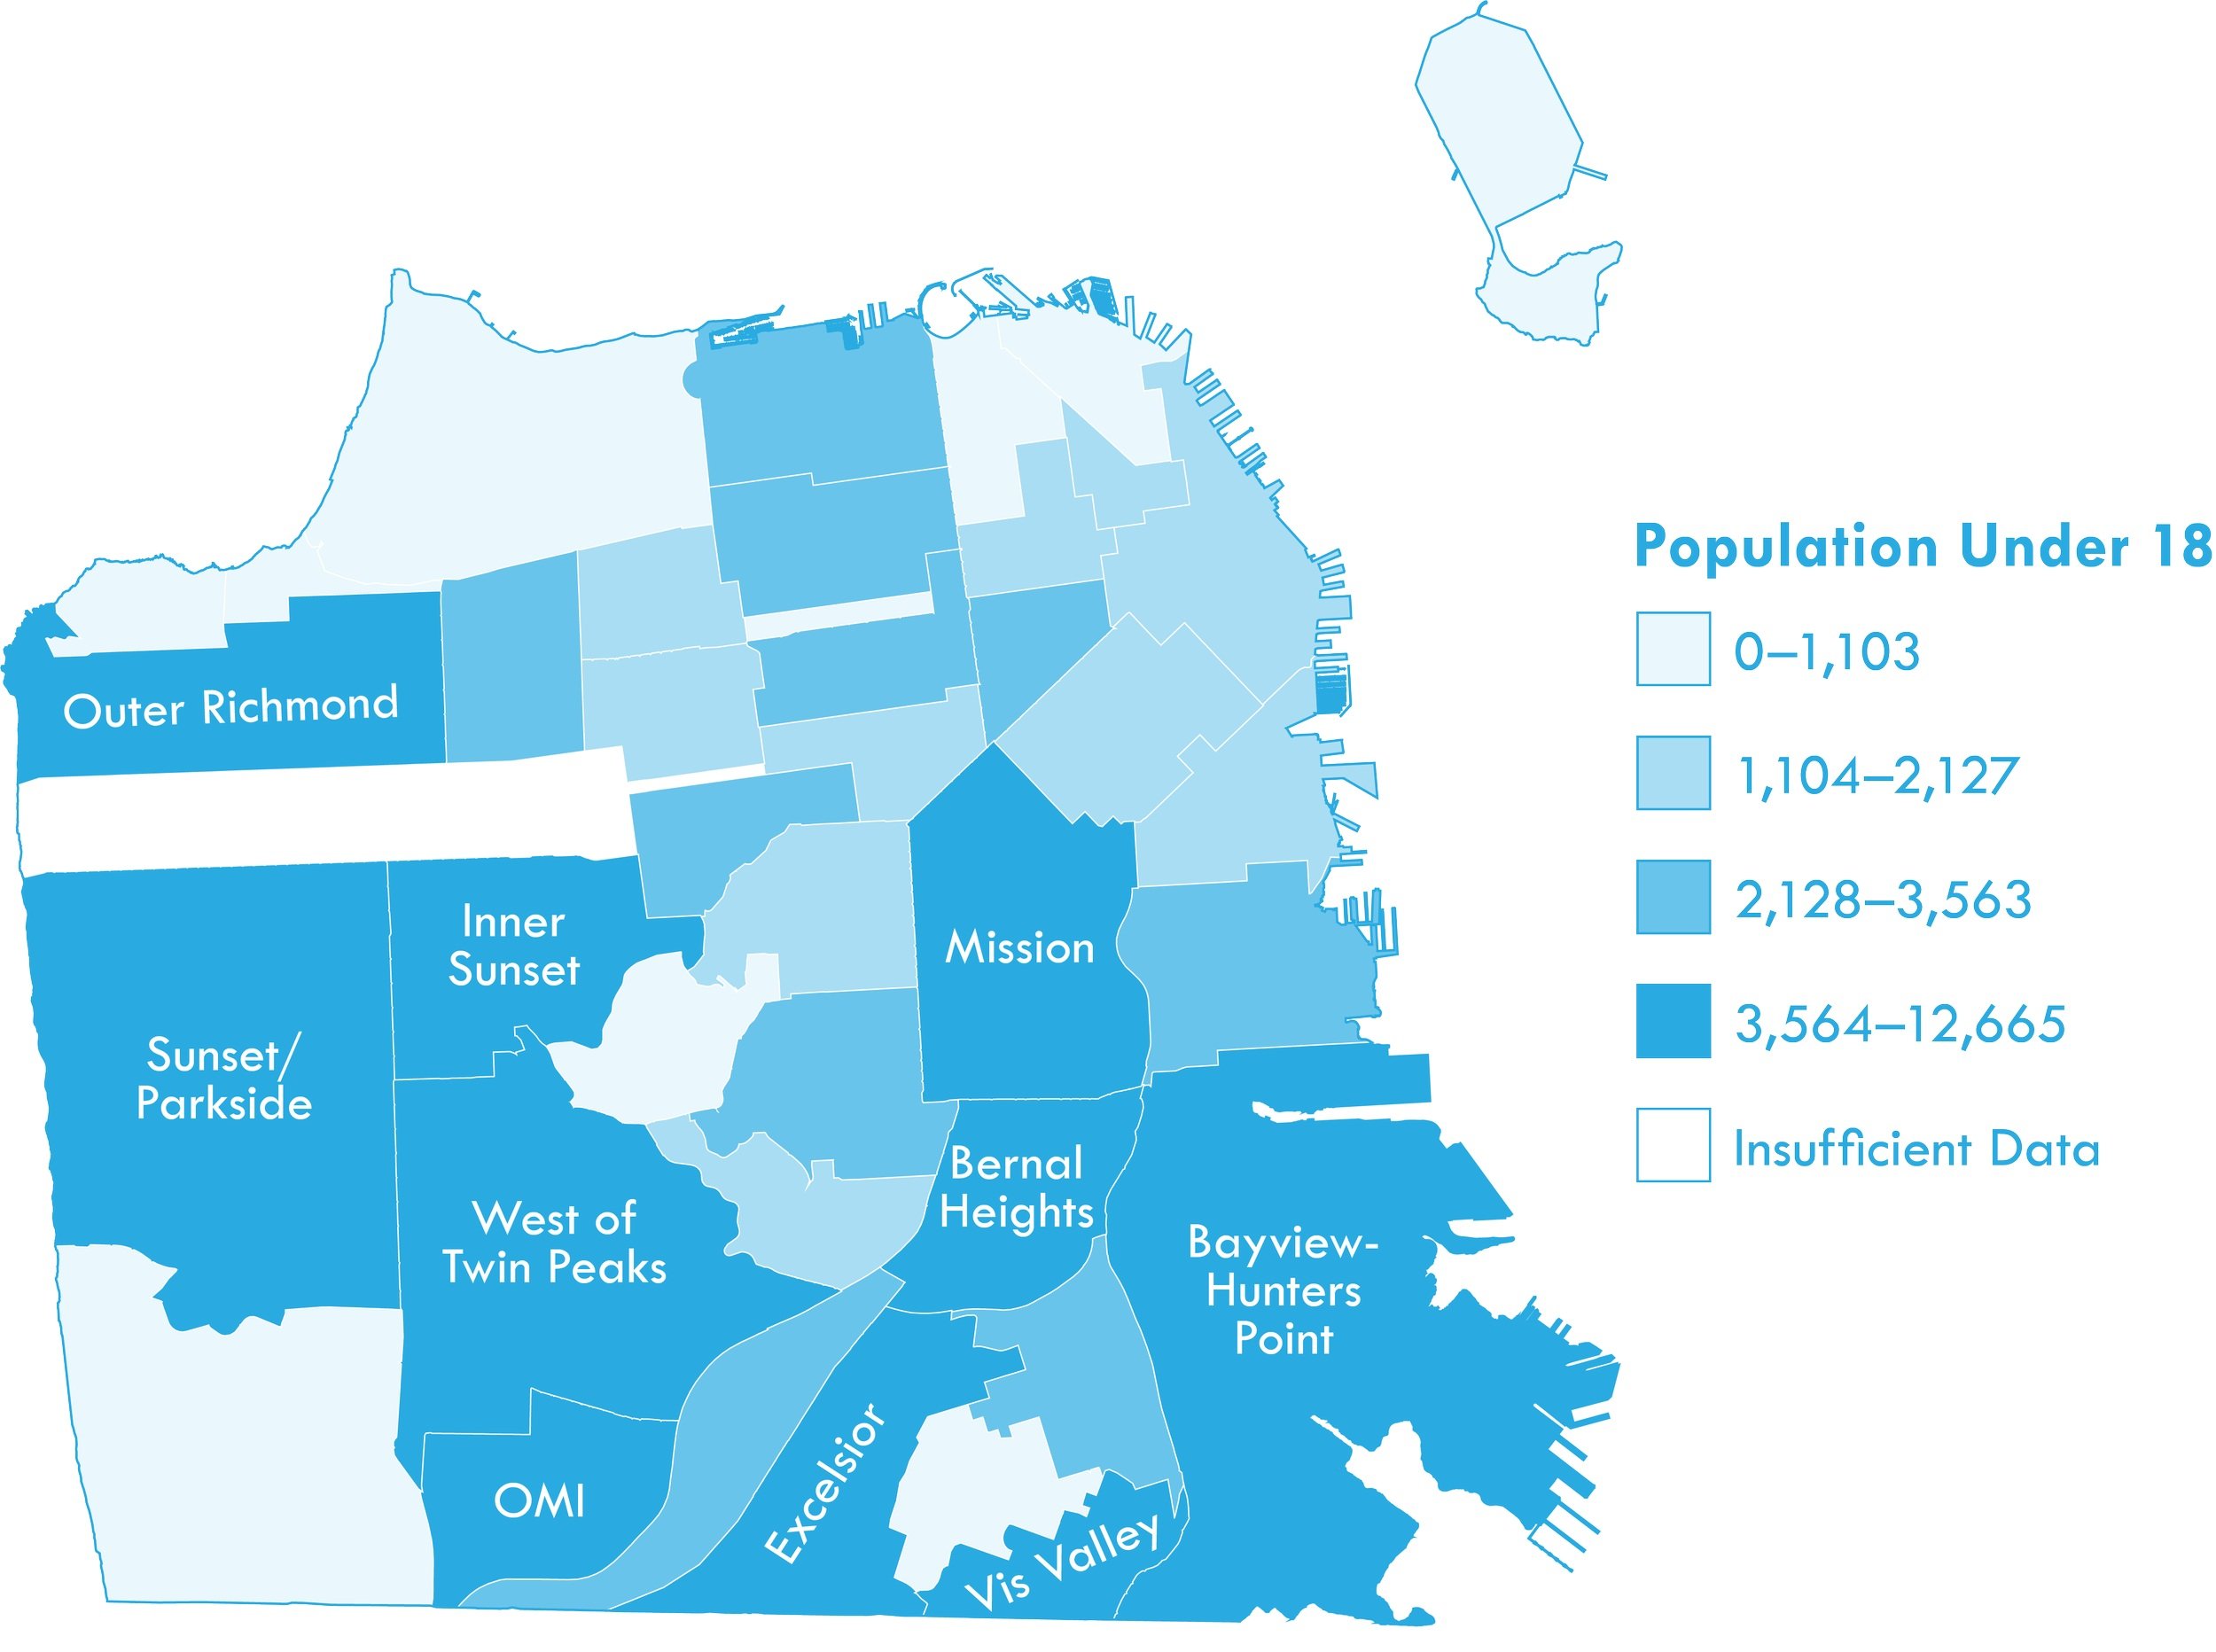
13.4% of San Francisco’s population is children and youth under 18, one of the smallest percentages of children in a major US city. In 2021, there were an estimated 113,227 youth under 18.
-
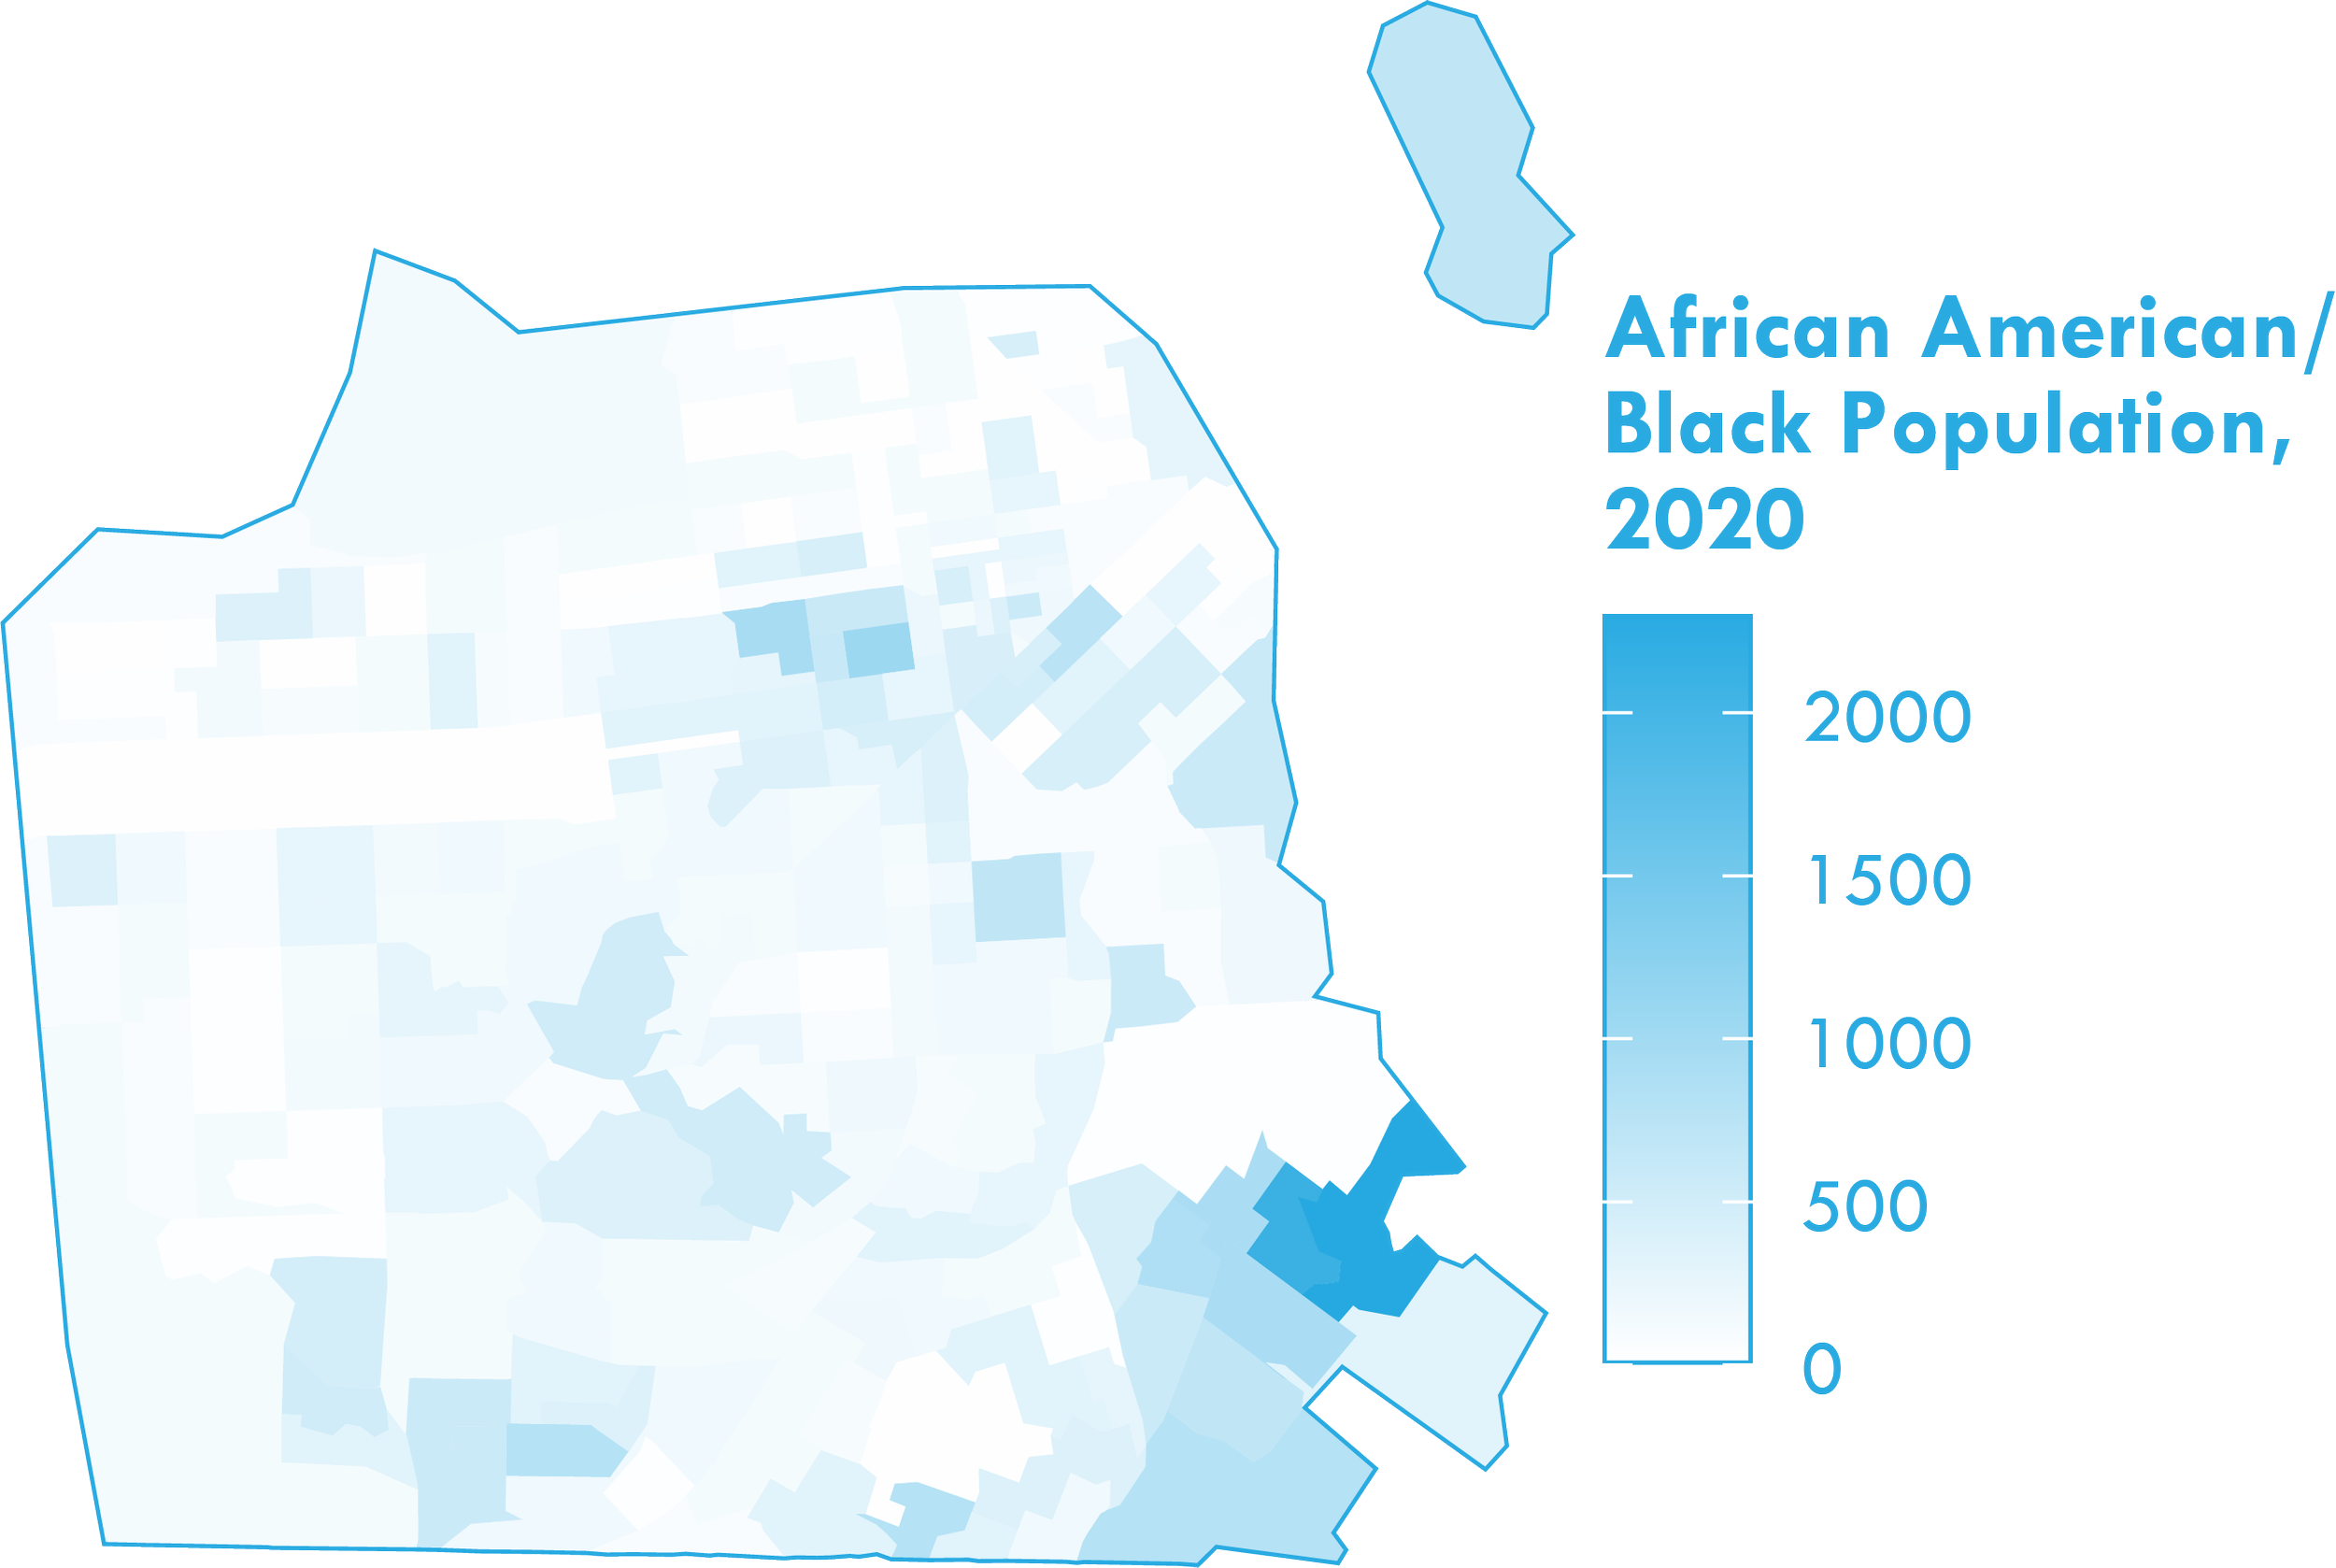
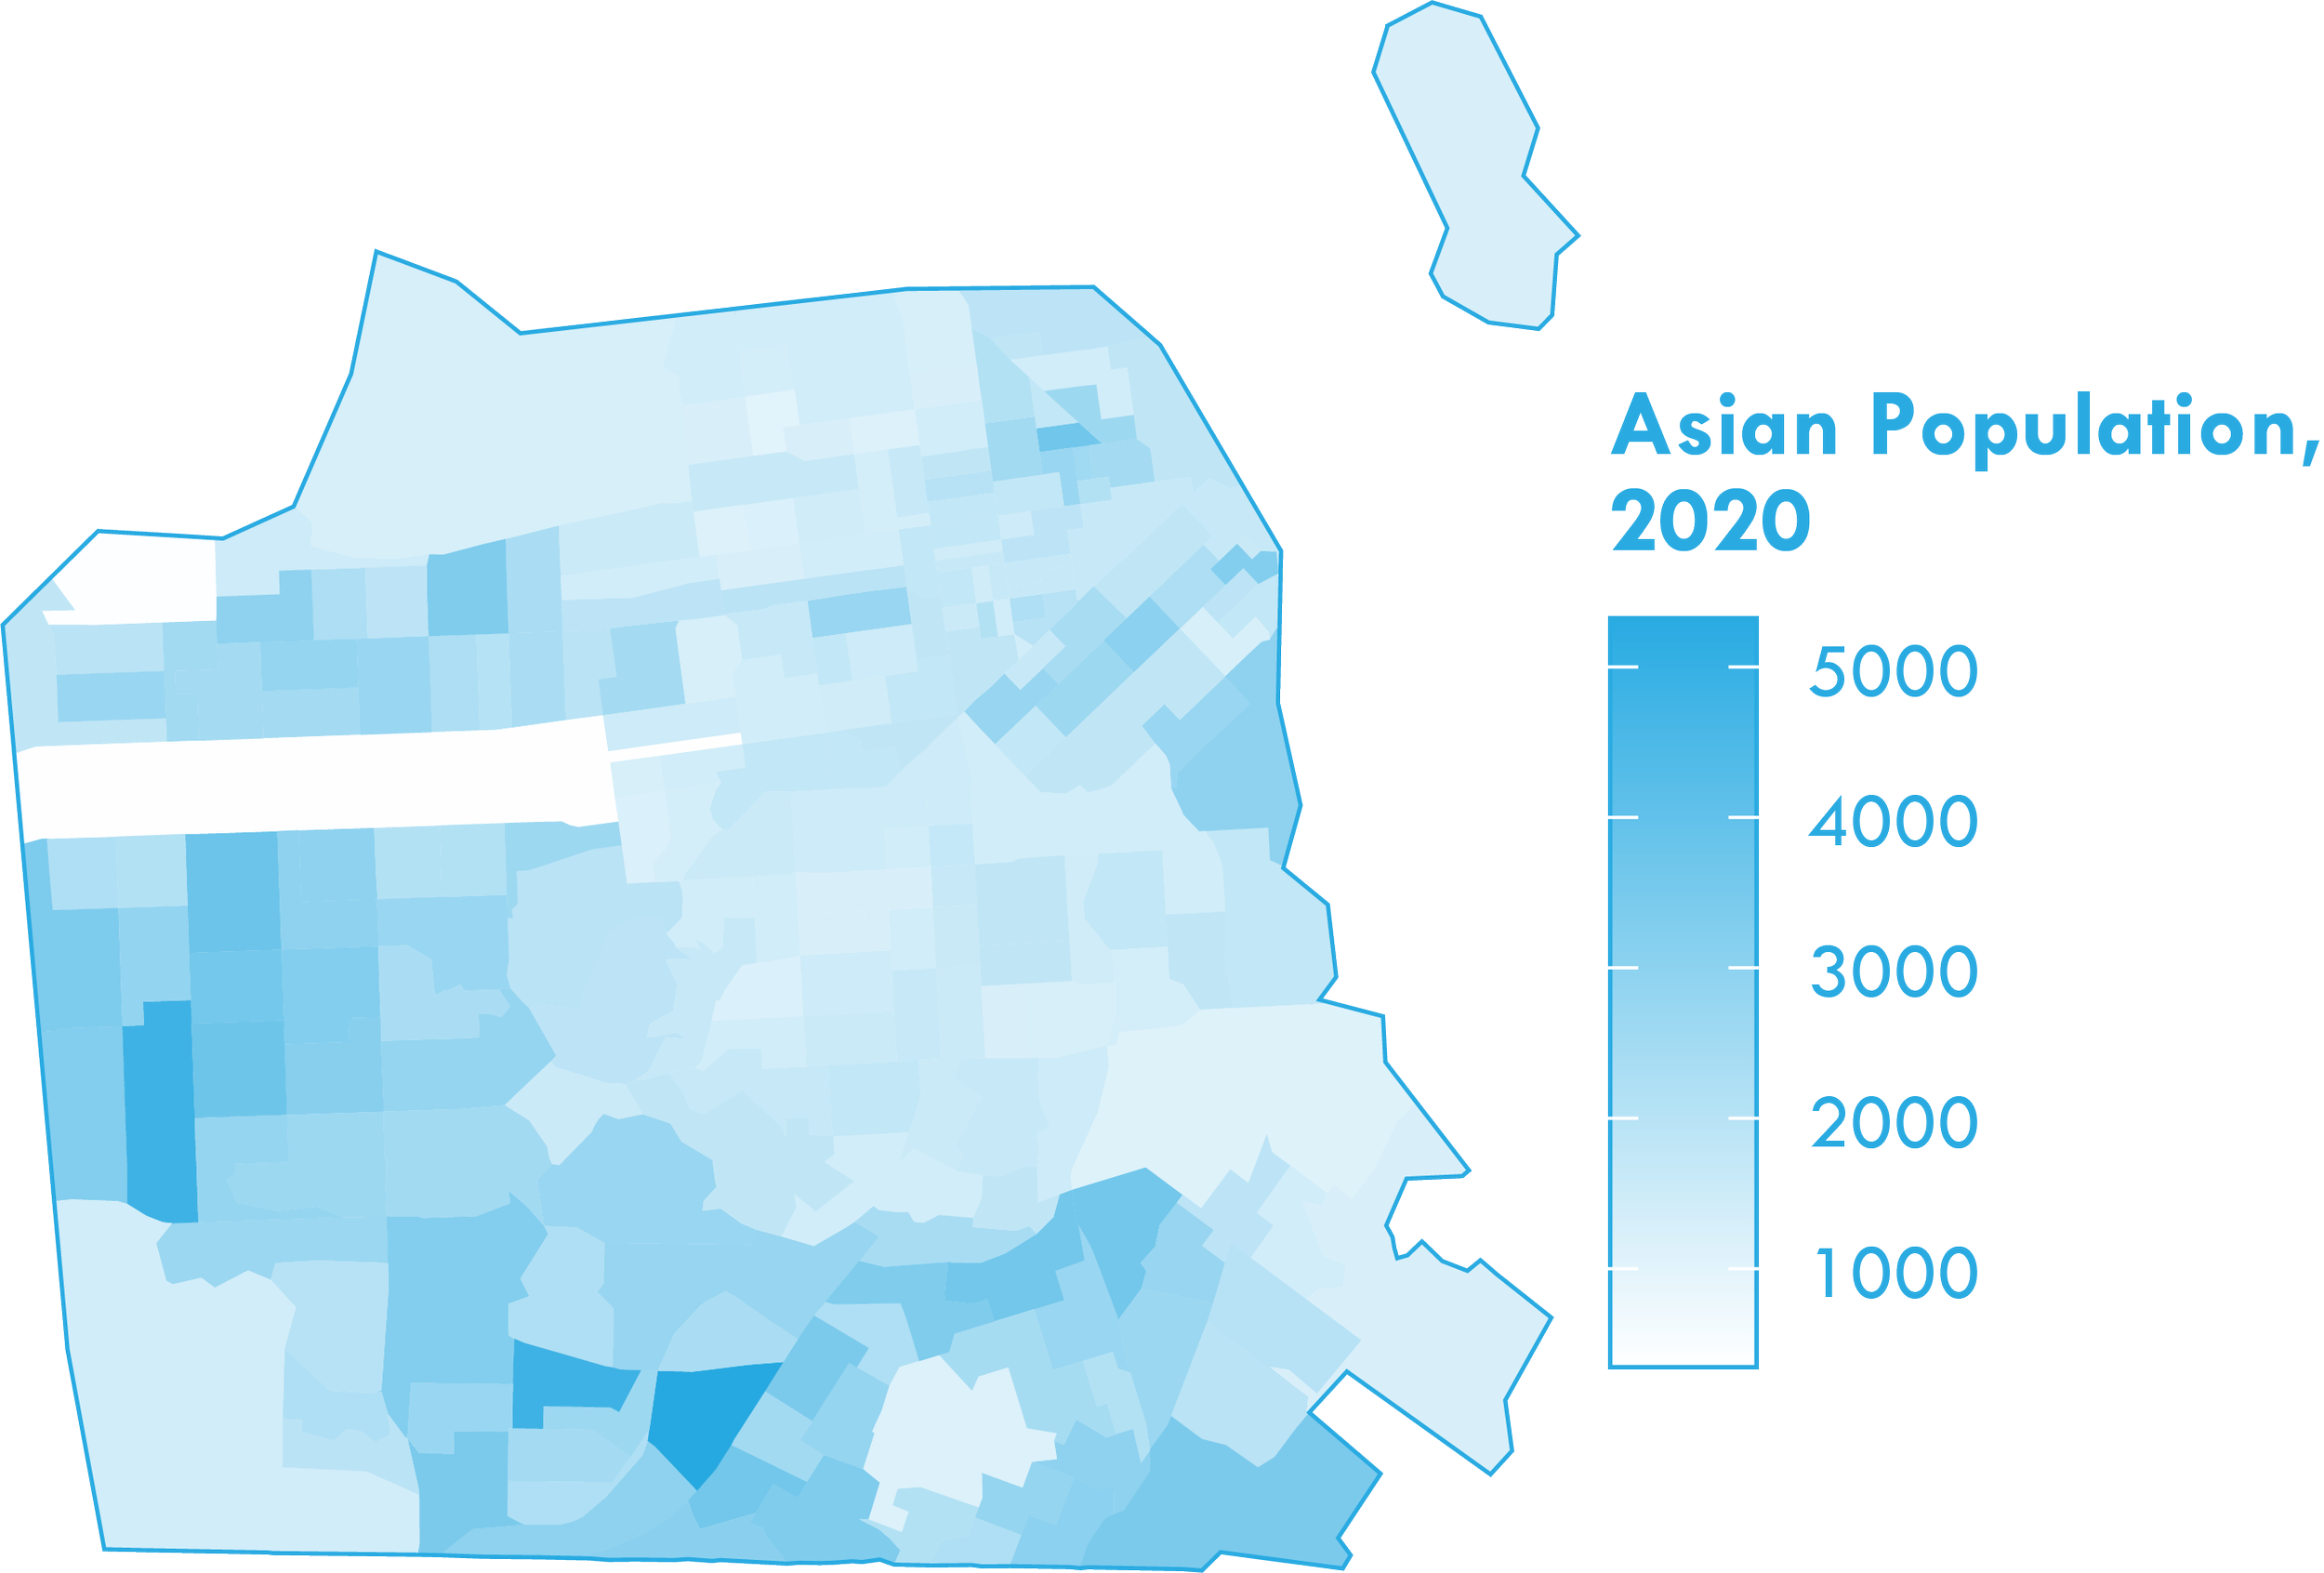
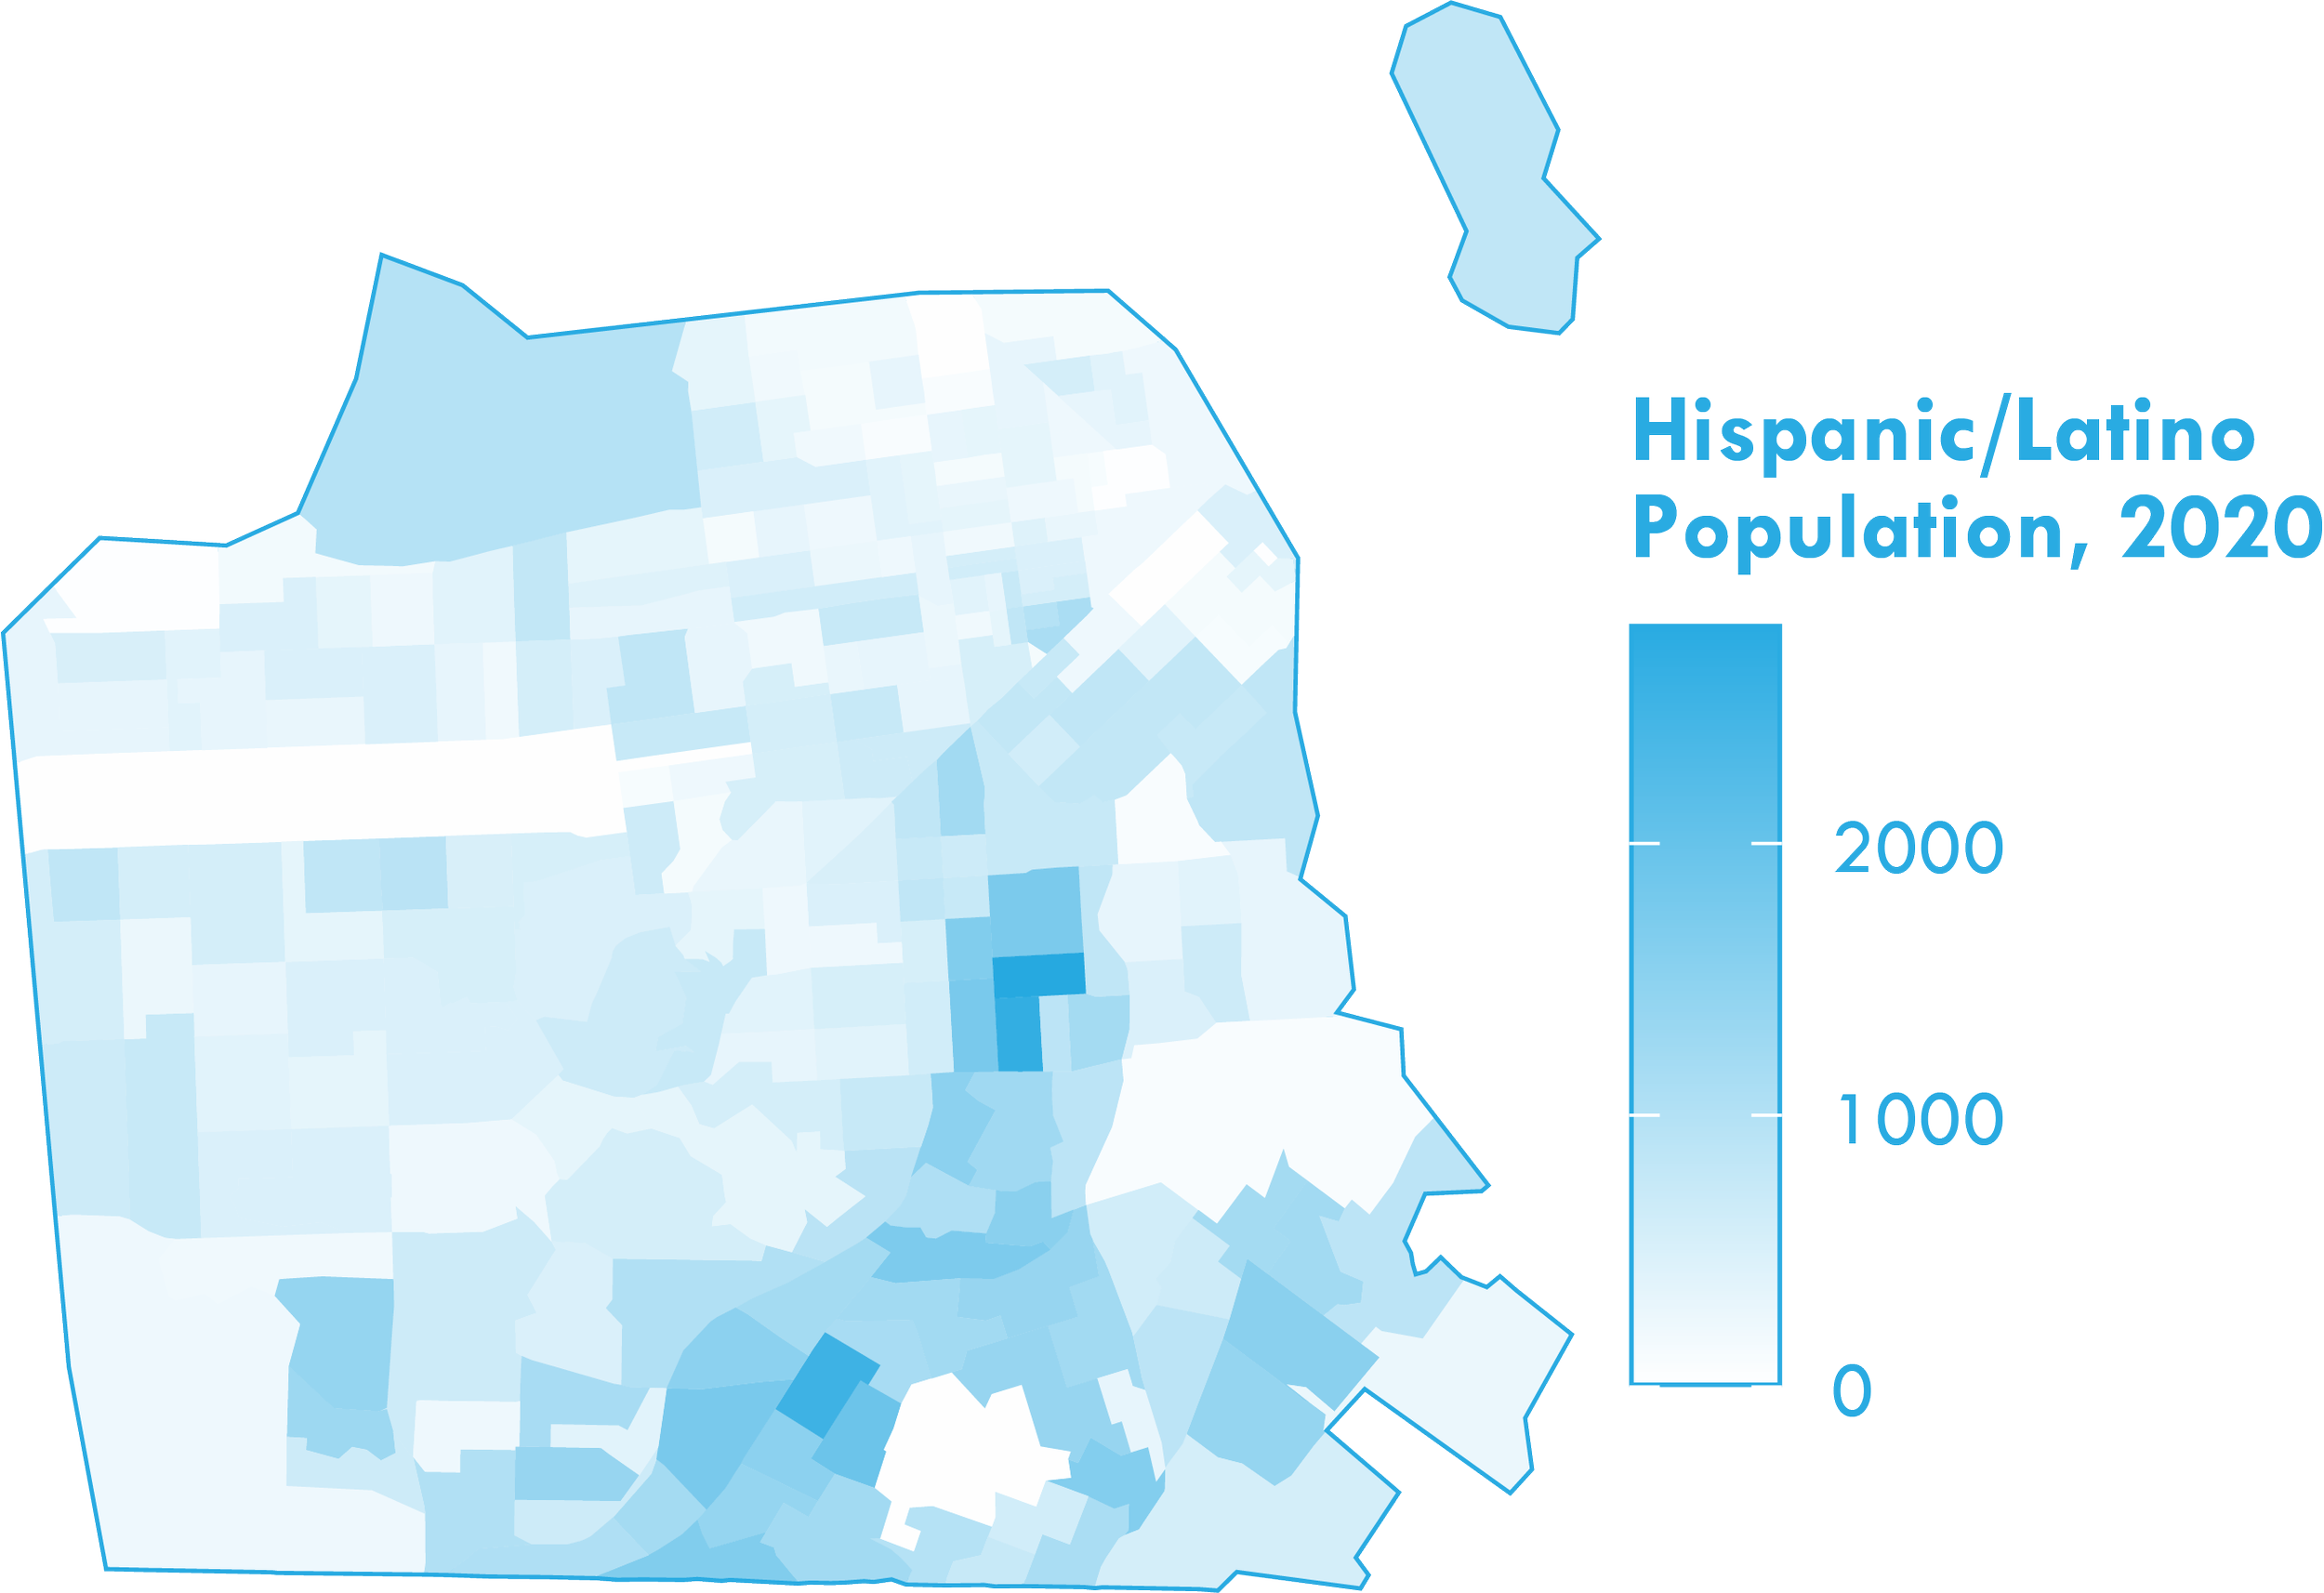
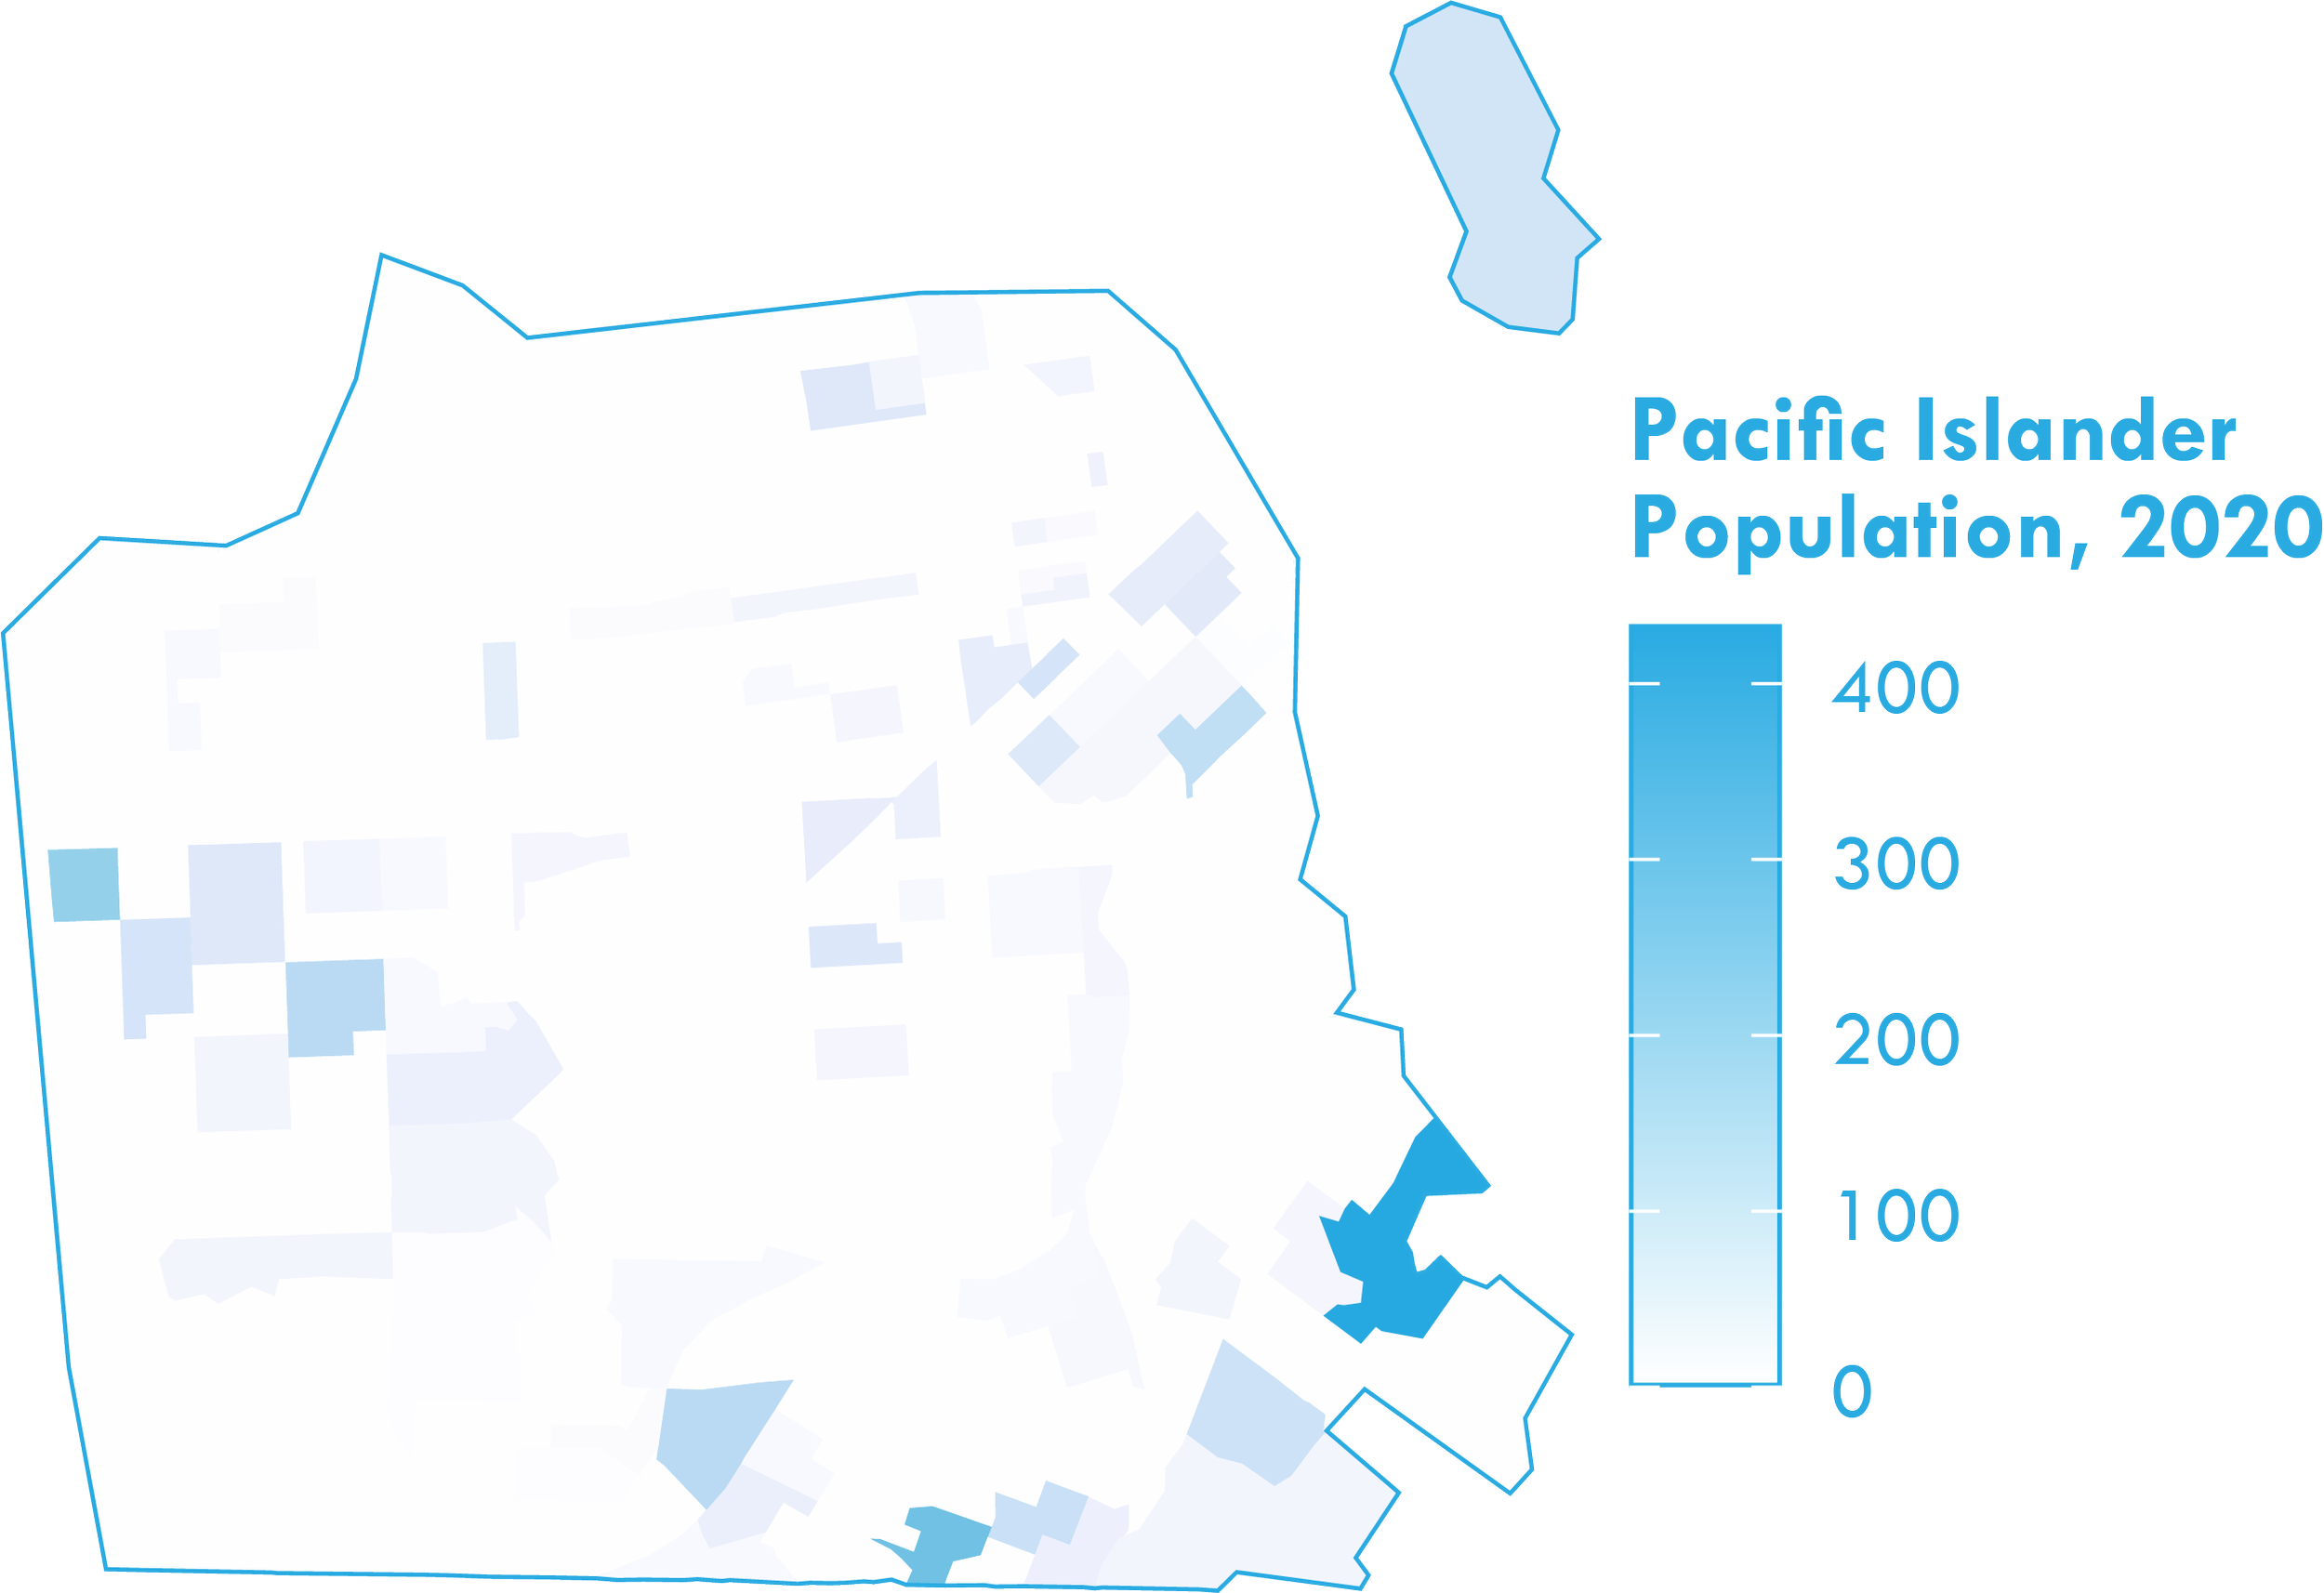
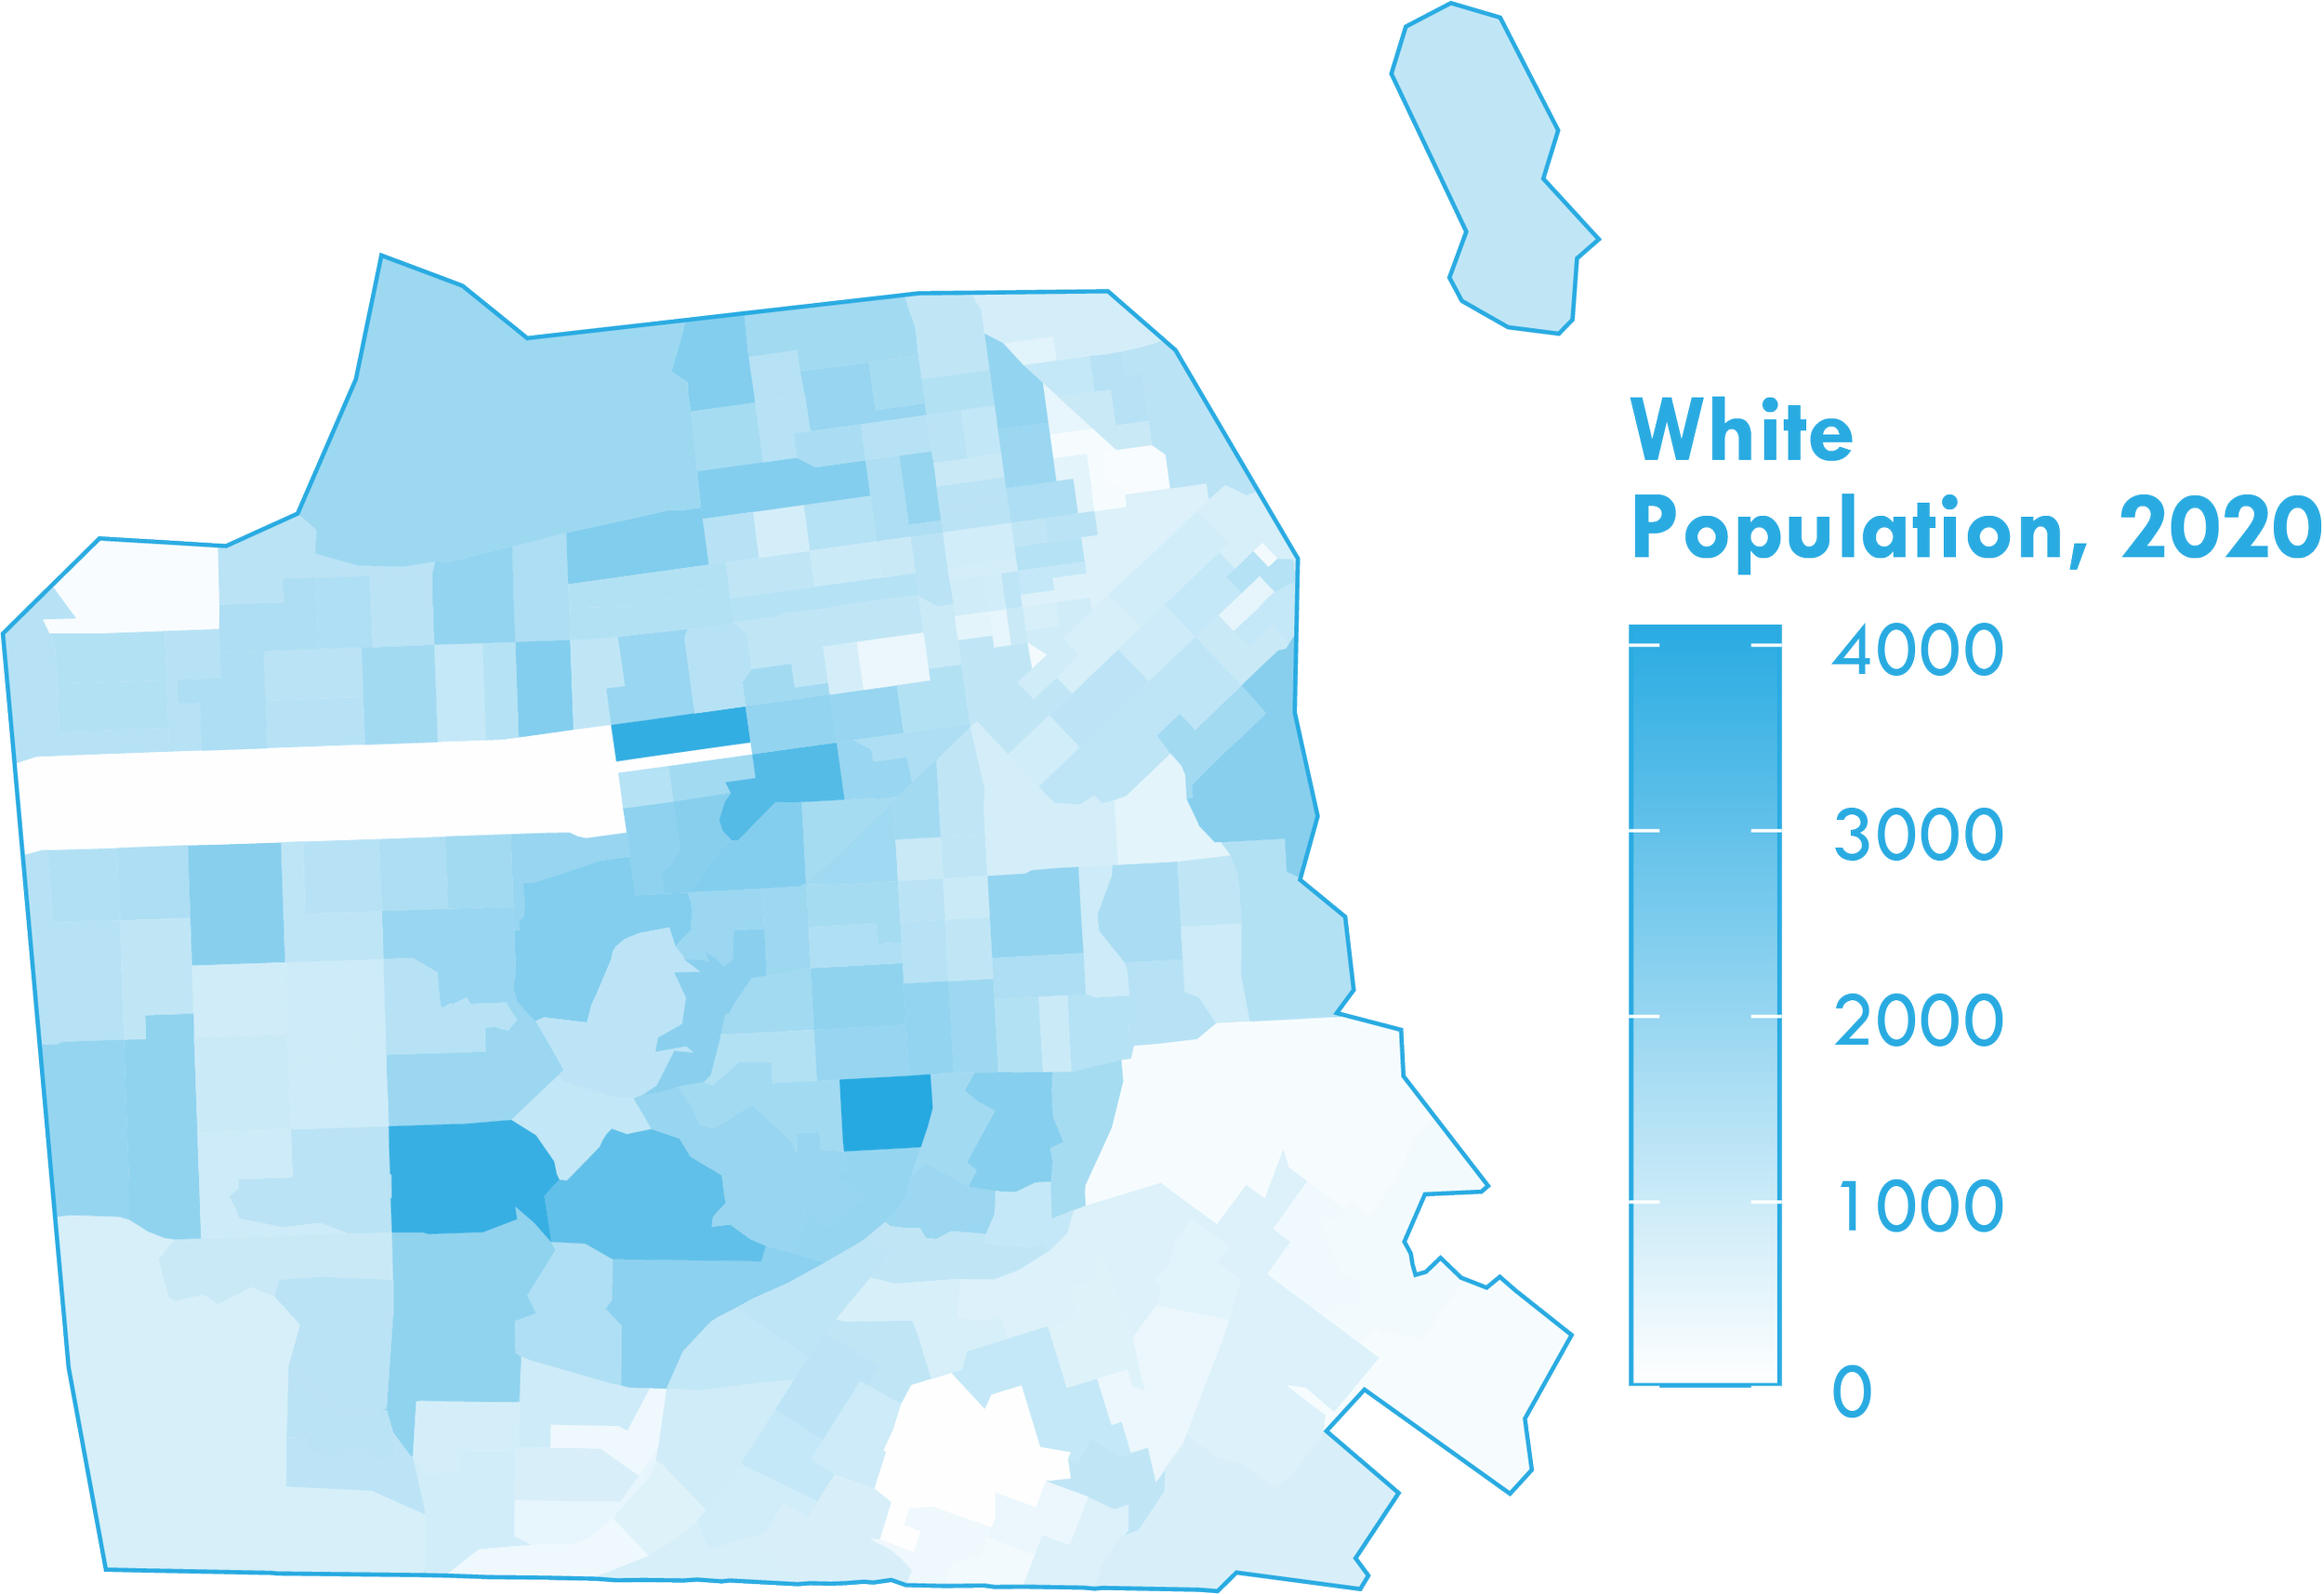
African American/Black, American Indian/Alaska Native, and Pacific Islander populations have declined in recent decades, while Multiracial, Asian, and Hispanic/Latinx populations have grown.
Over a third of San Francisco residents are immigrants born out of the country and an estimated 4,600 youth have undocumented immigration status.
The City’s diverse population live in micro-communities emblematic of racial segregation.


-
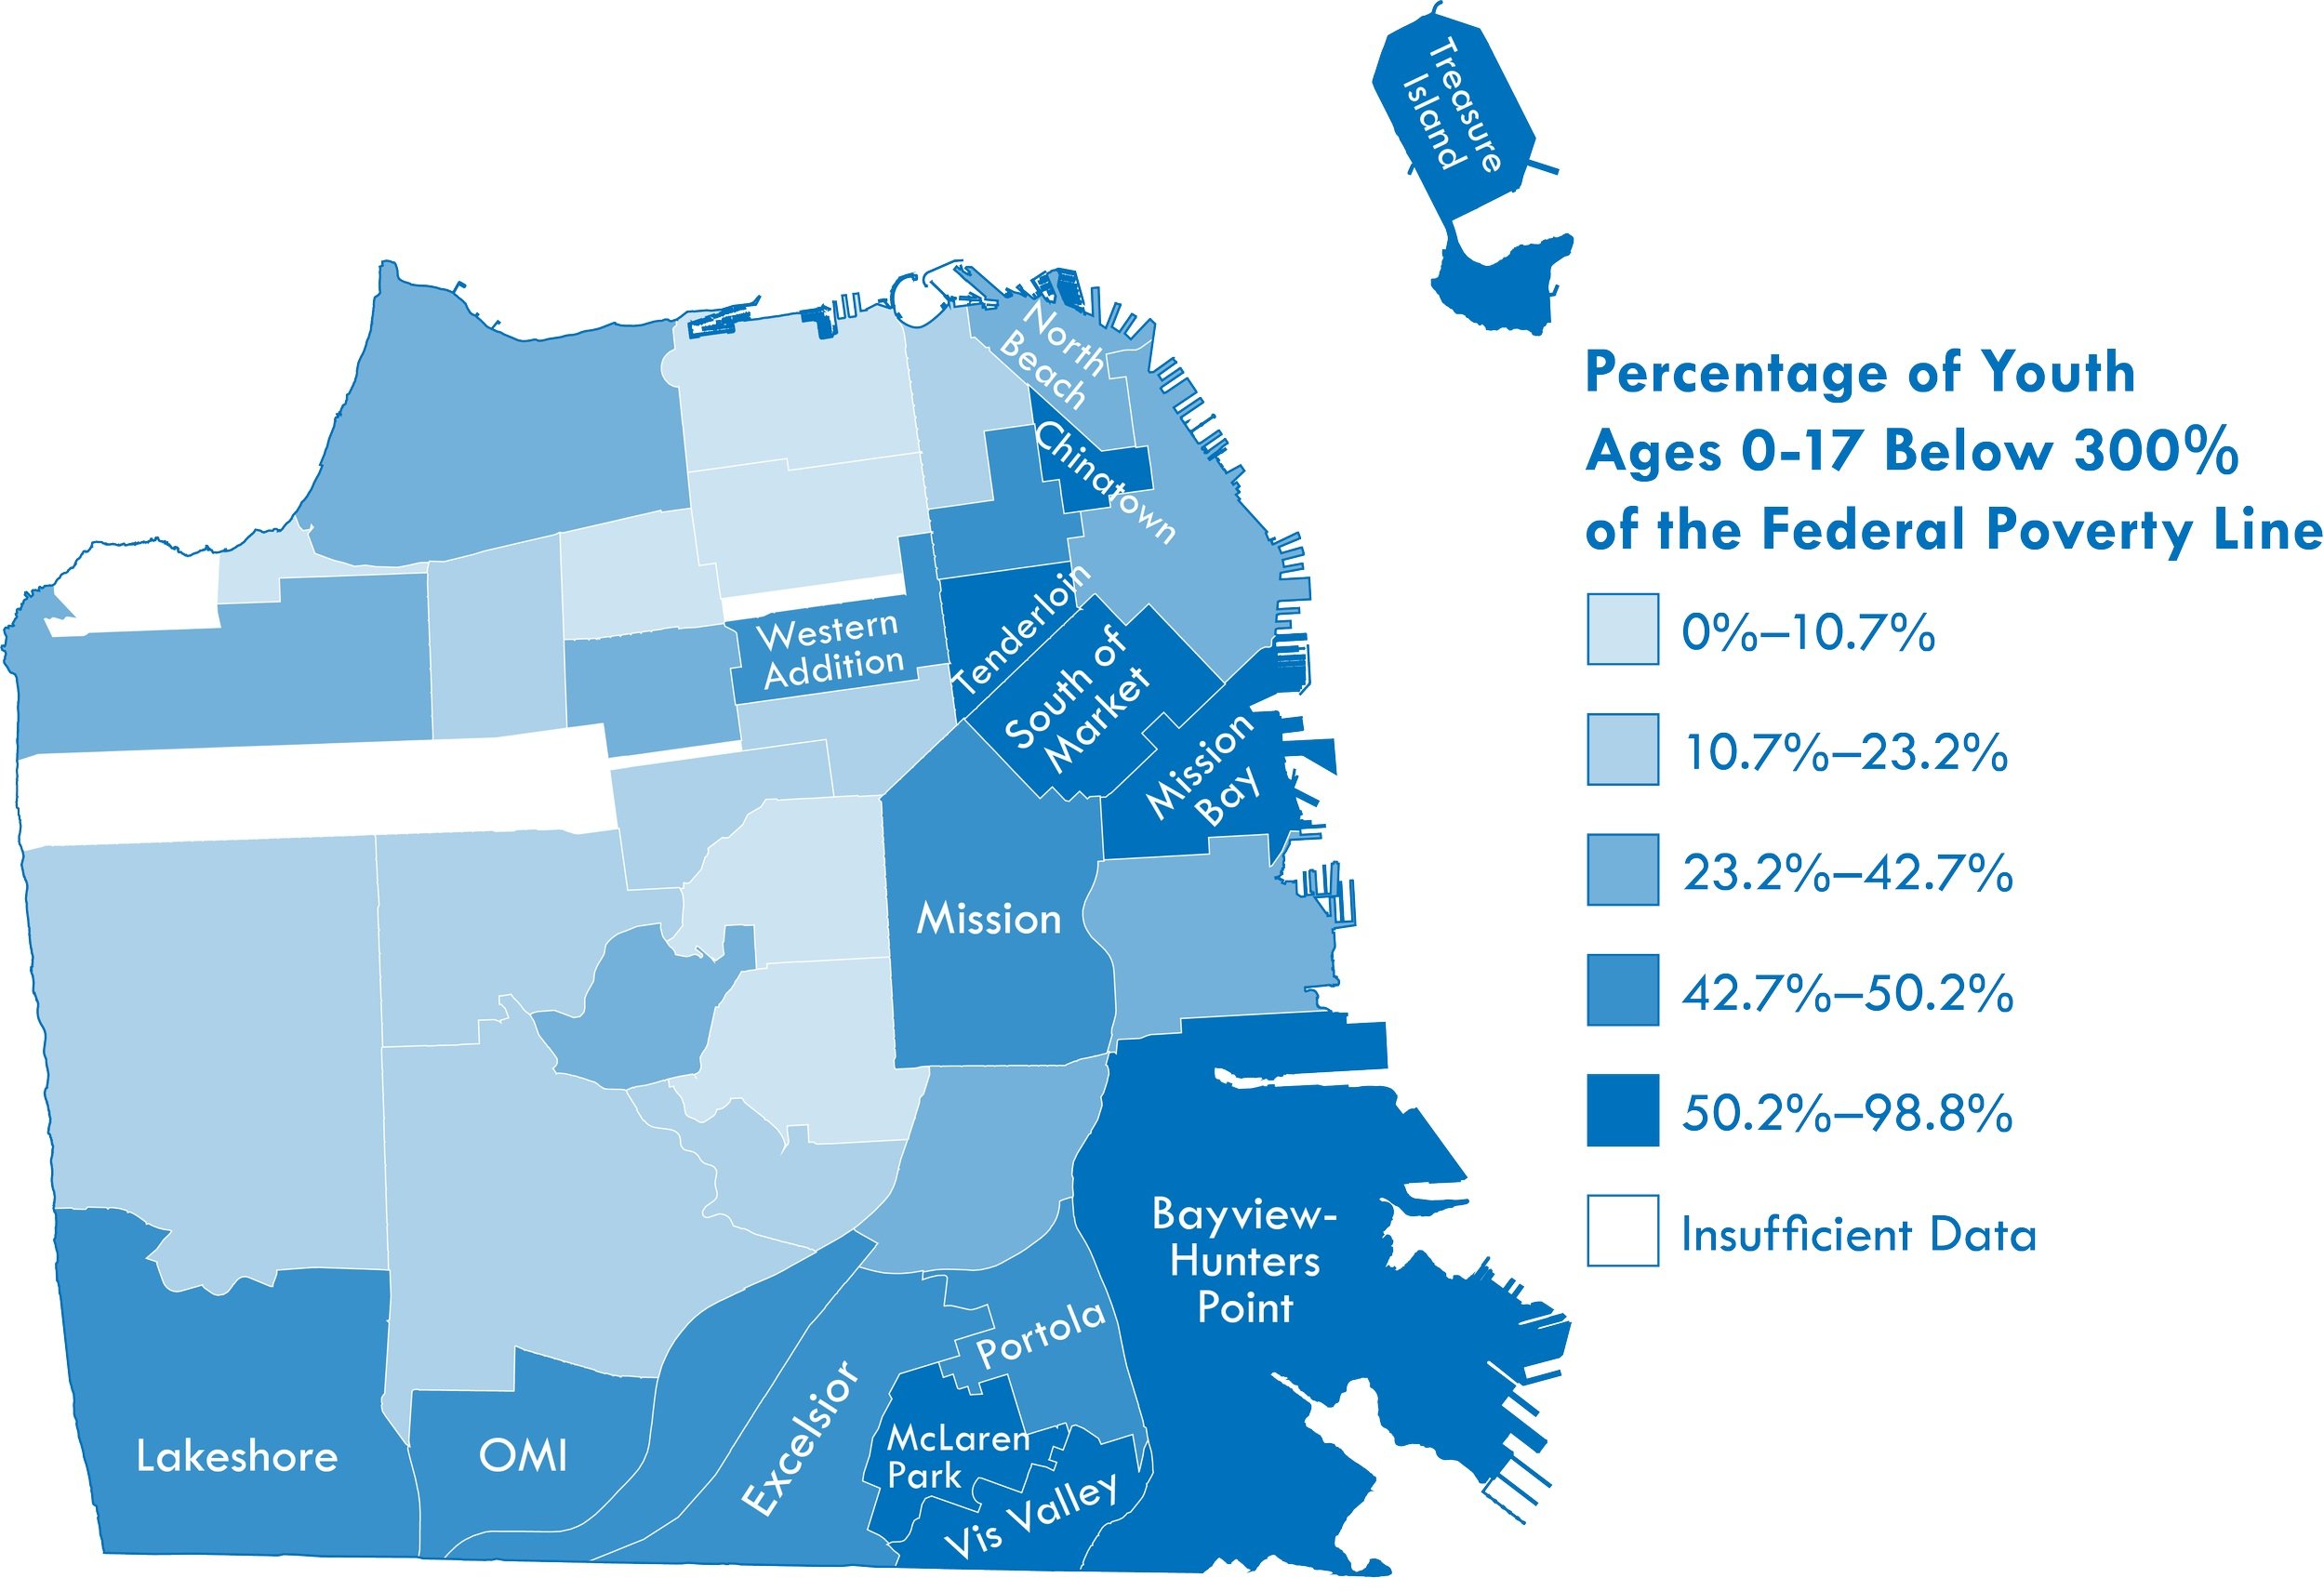
30% of youth ages 0-17 – nearly 34,000 youth – in San Francisco were living in families earning below 300% of the Federal Poverty Level (FPL) and an additional 17% or 19,000 youth were in families earning below 500% of the FPL.
Children of families living in poverty in San Francisco are more likely to be African American/Black, Hispanic/Latinx, Asian American/Pacific Islander, and American Indian.
Over half of children residing in Treasure Island, Chinatown, Tenderloin, South of Market, Mission, Bayview Hunters-Point, and the Visitacion Valley are living in families earning below 300% of the FPL.
-
In San Francisco, individuals and families living below 400% and even 500% of the FPL ($109,916 and $137,395 for a family of four) are considered low-income due to the high cost of living.
49% of DCYF parent/caregiver survey respondents felt they were able to manage paying their rent, utility, and bills “just fine.”
Only 42% of DCYF parents/caregivers survey respondents reported having a job that paid enough for their family’s expenses.
-
The 2022 Point in Time (PIT) Count of people experiencing homelessness in San Francisco reported 1,073 unaccompanied children and TAY, and 205 families experiencing homelessness.
“Just trying to balance making an income and being able to afford to live here. Parents are tied up and don’t have time to take advantage of the benefits of living in the city.”
“I’ve never had and don’t have now a space at home to be able to have peace and quiet. My uncle and cousin are using up all the space, causing noise. I need quiet, but it’s hard to stay focused without the right environment.”


-
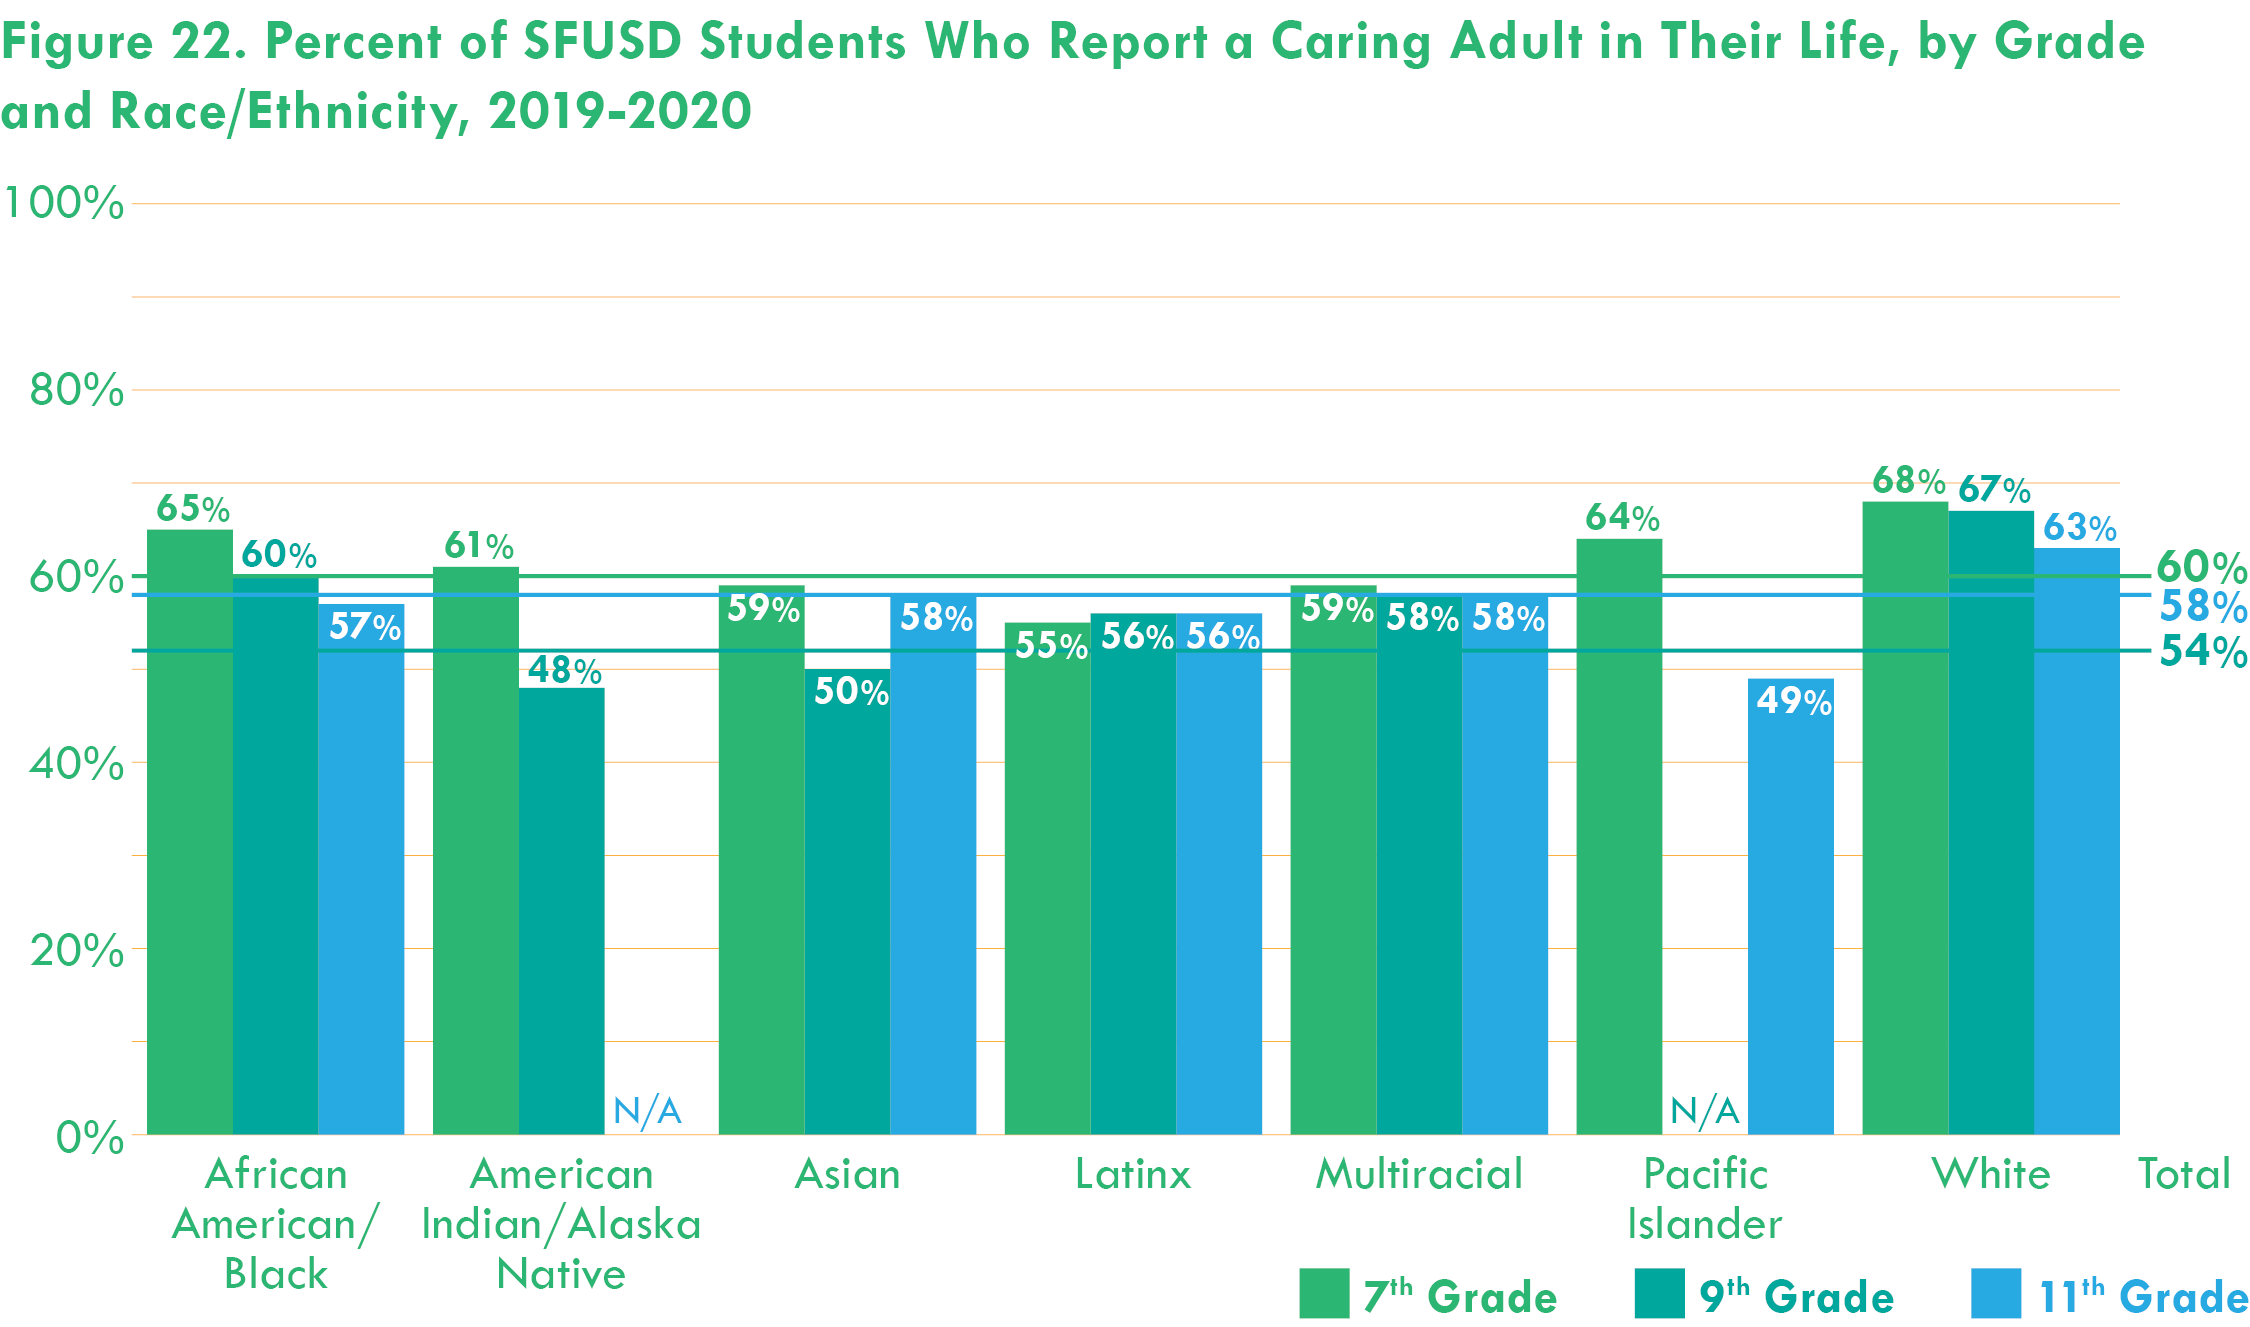
In 2019-20 school year, 54% of 9th grade respondents and 58% of 11th grade respondents expressed they had a caring adult relationship.
-
The number of youth up to 21 years old involved in the San Francisco foster system declined to 638 by December 2021. Youth of color and LGBTQQ youth continue to appear in foster systems at disproportionately high rates.
Despite a declining overall rate of youth in the justice system, a disproportinate number of African American/Black and Latinx youth have active probation cases.
Among 673 human trafficking cases reported in 2017, 70% were people of color and 70% were youth and TAY under age 25.
-
Only 45% of DCYF parent/caregiver survey respondents with children under age 5 felt their childcare was affordable.
-
46% of DCYF parent/caregiver survey respondents felt safe from violence in their neighborhood, and 47% of youth respondents felt safe in their community.
Roughly 24% of reported anti-Asian hate incidents in California in 2021-2022 took place in San Francisco.
“Some of us do not have DACA. It is very hard to access resources, especially when your family is undocumented. It is hard to access help when you don’t have certain paperwork. There is a tiered level of ability to get resources, even amongst undocumented people.”
“Childcare is a big need. We’re in the middle ground, don’t qualify and still not affordable. We don’t have extra family to help, so it’s hard.”
“I don’t want to target neighborhoods specifically as unsafe, but places where people are using substances, have mental health needs, more support needed. I don’t feel safe walking through there, and people are needing help that we’re not able to all provide.”

-
African American/Black mothers have a preterm birth rate of 16% compared to a citywide rate of 8%.
In the 2018-19 school year, African American/Black, American Indian/Alaska Native, Filipino, Hispanic/Latinx, and economically disadvantaged SFUSD students demonstrated much lower rates of aerobic capacity compared to their Asian and White peers.
12 of every 100,000 African American/Black 10 to 24 year-olds died by suicide in 2020; the rate has doubled since 2014 and is now twice the statewide average.
Research shows that Asian adolescents generally have higher rates of unmet mental health needs and are at greater risk for depression, anxiety, self-injury, and suicide than African American/Black or White youth.
-
During the COVID-19 pandemic, the number of San Francisco residents on CalFresh increased by 40%. (San Francisco Food Security Task Force, 2022 Recommendations)
A survey by the SF Marin Food Bank showed that households with children, especially single-parent households, had the highest rates of food insecurity among their clients.
-
The 2019 Youth Risk Behavior Survey (YRBS) suggests that mental health services are needed for approximately one-third of adolescents in San Francisco.
Data from the 2017-2019 YRBS show 43% of SFUSD students who identified as bisexual considered suicide and 18% attempted suicide, significantly more than heterosexual-identifying students (11% and 6% respectively).
48% of surveyed TAY experiencing homelessness suffered from a psychiatric or emotional condition, and 43% suffered from post-traumatic stress disorder. (Department of Homelessness and Supportive Housing, 2019 PIT Count)
“I know a lot of people who want to go to Kaiser, for example, for mental health services, but they’re swamped, they’re overloaded. There’s a lot of teens. I’m a high school counselor, and there’s a lot of teens that need access, and school resources are very limited until they try to go to Kaiser, and to no fault of their own, they just don’t have all the support services that they need.”
“Support for anxiety and depression, that should be across the board for the kids. My granddaughter, the middle one, for some reason, she’s having anxiety. I don’t know why, or when it started, she likes to stay isolated for some reason.”

-
SFUSD K-12 enrollment declined by 7% from the 2019-20 school year to the 2021-22 school year. White and Filipino enrollment declined by 14%, and American Indian student enrollment declined by 21% between the 2019-20 and 2021-22 school years.
-
Between 2017-2019, only 30% of African American/Black youth expressed feeling a high level of school connectedness.
Between 2017 and 2019, 42% of surveyed LGBTQQ students in SFUSD reported being bullied at least once in the previous year, compared to 27% of their straight peers.
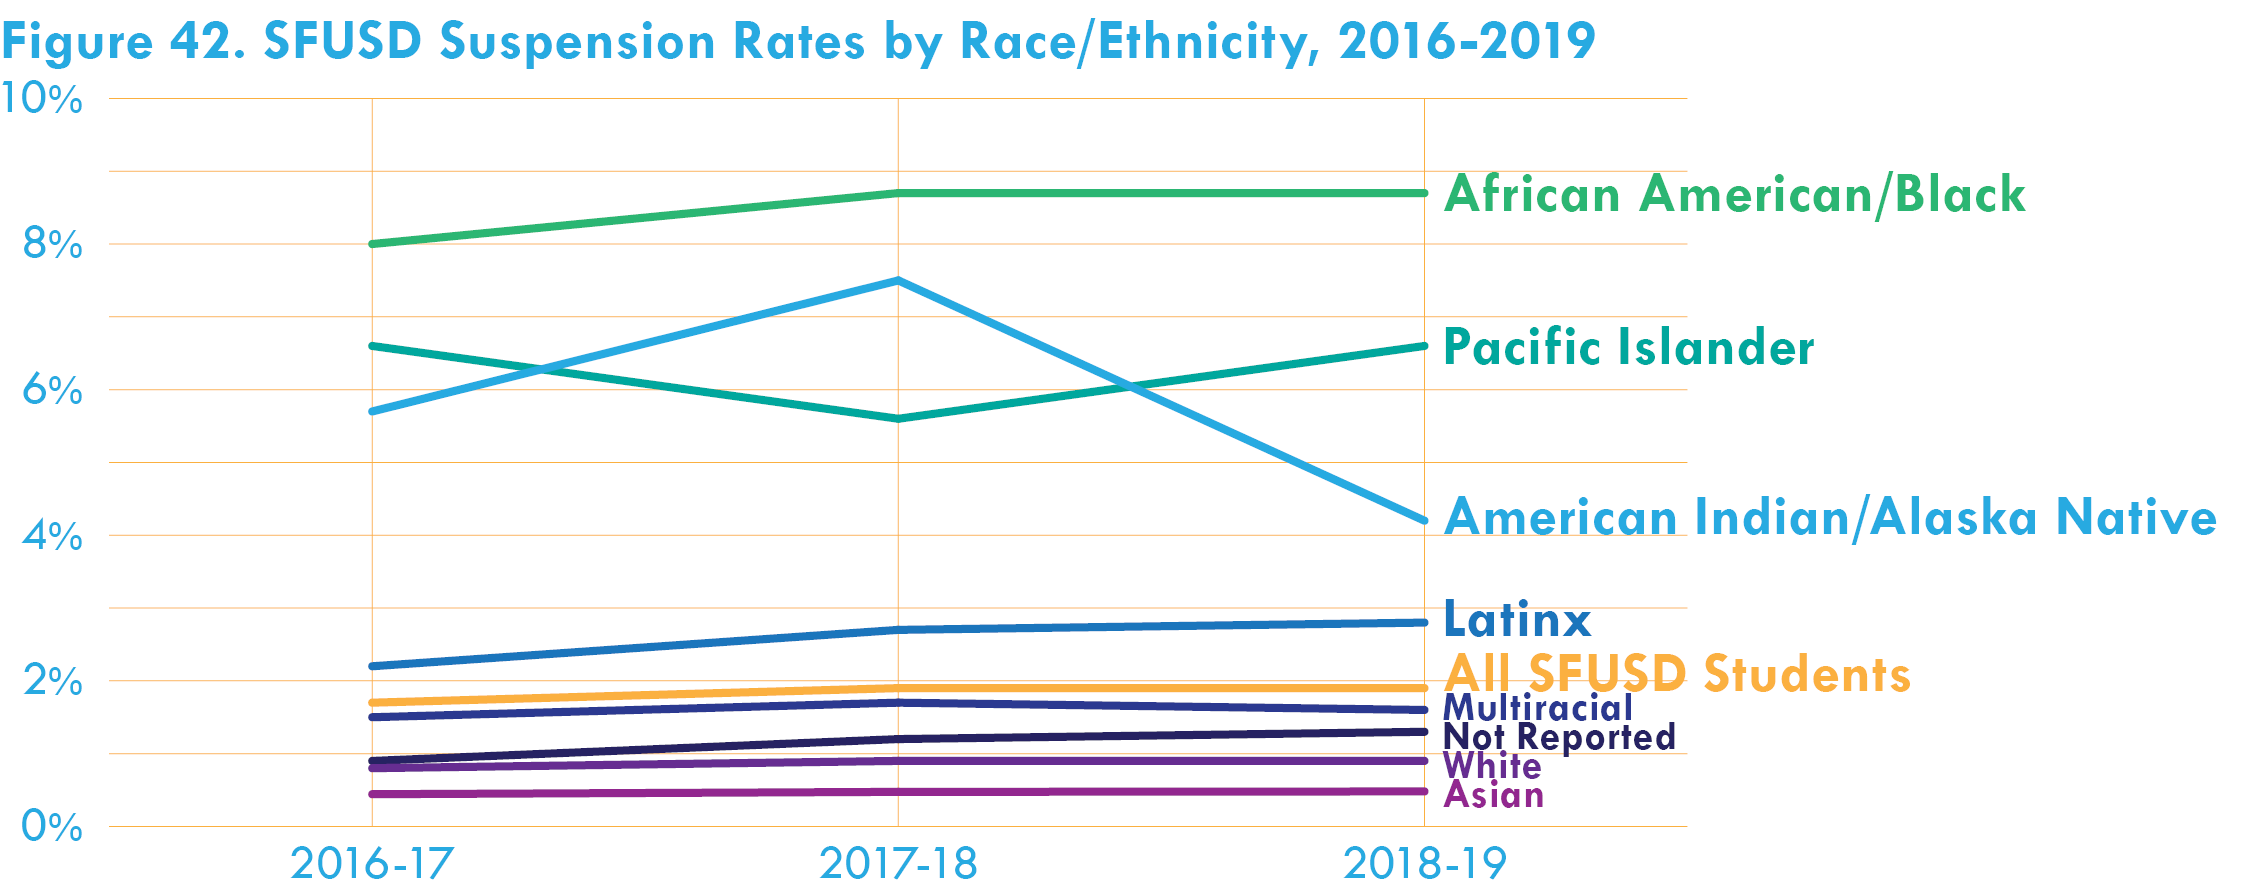
75% of students who receive school suspensions are socioeconomically disadvantaged.
-
High schoolers make up the majority (63%) of students who are chronically absent. Rates of chronic absences among foster youth, youth experiencing homelessness, and students with disabilities are significantly higher than average.
Academic proficiency in Reading/English Language Arts and Math are disproportionately below average among African American/Black, American Indian, Latinx, and Pacific Islander students. Rates of academic proficiency are particularly low for students experiencing low socioeconomic status, housing instability, and foster system involvement.
“The life of being a public school parent or educator is that we are always trying to make the best of underfunded schools but I feel like we can go too far to the point where it’s gaslighting to try and paint things that are cuts as opportunities. I would like us to be very frank for the benefit of our city about what the costs of these cuts are. We are a city with 75 billionaires—the most dense in the world. I’m really concerned when we talk about shifting staff...because every time that happens school sites that don’t have large PTAs end up experiencing cuts in real time.”
“They need more staff at school for children’s safety. A lot of behavioral issues at school and teachers don’t say anything.”
“They need interpersonal and social emotional guidance on how to deal with kids again and navigating friendly play and disagreements. They need extra reading and writing support because that was ineffective online. They need reading comprehension and writing planning and editing skills.”
“[Our family’s greatest need is] financial assistance for potential After School programs. Worried can’t afford this fall and not sure what to do with my 6th grader considering school starts so late (9:30) and gets out before I may be able to pick him up.”
“We want kids with disability to be able to go to any camp they want to. The city needs to provide the staffing and hiring and training so this is possible.”

-
58.1% of San Francisco residents who are 25 years or older have a bachelor’s degree, compared to 34.7% in California and 32.9% nationally.
-
The average four year graduation rate for SFUSD high school graduates was 88% in the 2020-21 school year, with lower rates reported among students who are American Indian/Alaska Native, Hispanic/Latinx, Pacific Islander, and African American/Black.
In the 2020-21 school year, the five year graduation rate for foster youth was 64.5%. When youth are supported by a court-appointed educational rights holder, graduation rates have been shown to increase to between 80% and 90%.
In the 2020-21 school year, less than half of African American/Black (42%), Pacific Islander (43%), and Hispanic/Latinx (51%) SFUSD graduates met UC/CSU requirements.
-
More than 80% of SFUSD high school students surveyed by DCYF in 2021 reported an interest in jobs and internships.
Only 43% of DCYF parent/caregiver survey respondents agreed that they had access to job training for their TAY-aged child.
65% of SFUSD high school students surveyed by DCYF in 2021 expressed interest in career preparation programs/activities.
“Have programs to help kids go through adulthood, especially if they don’t have family members to help them with that. Have classes to learn how to be financially independent, manage their money, make money, do taxes, cook for themselves.”

-
Overview of SF:
U.S. Census Bureau, American Community Survey, 2019 ACS 1-Year and 5 -Year Estimates.
U.S. Census Bureau, 2020 Decennial Census.
Opportunity in SF:
San Francisco Department of Homelessness and Supportive Housing, “2022 Point-in-Time Count: Preliminary Results.”
U.S. Census Bureau, American Community Survey, 2019 ACS 1-Year and 5 -Year Estimates, IPUMS.
Nurturing Families and Communities:
City and County of San Francisco, “Children in Foster Care: City Performance Scorecards.”
San Francisco Arts Commission, “San Francisco City Leaders and Community Partners Launch New ‘Campaign for Solidarity’ to Unite the Entire City Against Hate, Bias and Violence.”
San Francisco Department on the Status of Women, “Human Trafficking in San Francisco,” July 24, 2019.
San Francisco Juvenile Probation Department, “San Francisco Juvenile Probation Department Monthly Statistics Through December 2021,” February 9, 2022.
San Francisco Unified School District, “California Healthy Kids Survey, 2019-2020: Main Report,” WestEd Health and Justice Program for the California Department of Education, February 13, 2020.
Physical and Emotional Health:
Applied Survey Research, 2019 San Francisco Youth Homeless Point-in-Time Count and Survey, San Francisco Department of Homelessness and Supportive Housing, January 30, 2020.
California Dept. of Education, “Physical Fitness Test,” 2018-2019.
Centers for Disease Control and Prevention, “Youth Risk Behavior Survey,” August 18, 2021.
Chinese Progressive Association - Youth Movement of Justice and Organizing, “Our Healing in Our Hands: Findings from A Mental Health Survey With San Francisco Unified School District High School Youth,” 2018.
San Francisco Department of Public Health, “San Francisco Live Birth Disparities Summary 2011-2020.”
San Francisco Food Security Task Force. “San Francisco Food Security 2022 Recommendations,” 2022.
San Francisco Marin Food Bank, 2021 Hunger Report.
San Francisco Unified School District, “California Healthy Kids Survey, 2018-2019: Main Report,” WestEd Health and Human Development Program for the California Department of Education, February 13, 2020.
U.S. Surgeon General’s Advisory, “Protecting Youth Mental Health,” U.S. Department of Health and Human Services, Office of the Surgeon General, 2021.
Readiness to Learn and Succeed in School:
California Department of Education, “San Francisco Unified Report: 2021-22 Enrollment by Ethnicity for Charter and Non-Charter Schools,” DataQuest.
California Department of Education, “San Francisco Unified Report: Suspension Rates by Ethnicity,” DataQuest.
San Francisco Unified School District Board of Education, “Board of Education Meeting: District PK-12 Data Summary Slides (2020-21 Outcome Metrics),” September 28, 2021.
San Francisco Unified School District, “SY2021-22 Mid-Year Data Summary,” February 3, 2022.
KidsData, “Bullying/Harassment, by Sexual Orientation.”
KidsData, “School Connectedness (Student Reported), by Race/Ethnicity.”
Readiness for College, Work, and Productive Adulthood:
California Department of Education, “Five-Year Cohort Graduation Rate – Statewide,” DataQuest.
California Department of Education, “Four-Year Adjusted Cohort Graduation Rate - San Francisco Unified District,” DataQuest.
U.S. Census Bureau, American Community Survey, 2016 ACS 5 -Year Estimates.
Next Steps
DCYF’s Services Allocation Plan
The CNA is the first step in DCYF’s planning cycle. The data highlighted here will guide DCYF's next planning step: our Services Allocation Plan (SAP). The SAP will describe how Children and Youth Fund dollars will be allocated for the 2024-29 funding cycle. During the SAP development process, DCYF will examine how well priority populations are being reached and service needs are being met through existing investments and partnerships. Our process will center the data and findings from the CNA to ensure that our allocations address the needs and disparities highlighted in this report. Planning for our upcoming SAP is in progress at DCYF. For more information on our previous SAP, please click here.
CNA Resources
Access additional documents related to the Community Needs Assessment, including the 2015-16 CNA: